Performance metrics reflect the specific sessions you have filtered to. When you change your date range, scenario, or group filters, the numbers update accordingly — performance answers “How did these sessions go?” for the exact context you’re looking at.For a stable, person-level measure of capability that doesn’t change with filters, see Skill Proficiency and Reports.
Understanding Performance Metrics
| Metric | What It Means |
|---|---|
| First | Score from the participant’s earliest session in your filtered view |
| Best | Highest score achieved across all sessions in view |
| Average | Mean score across all sessions in view |
| Lift | Best minus First — shows improvement. Only appears for participants with 2+ sessions. |
Skill Performance in Roleplay Analytics
Navigate to Roleplays → Analytics in the left sidebar and scroll past the summary metrics to find the skill performance views.Available Filters
Available Filters
| Filter | What It Does |
|---|---|
| Date Range | Limits to sessions within a specific time period |
| Users | Limits to specific people |
| Groups | Limits to members of selected groups |
| Programs | Limits to sessions from specific learning programs |
| Roleplays | Limits to specific roleplay assignments |
| Scenarios | Limits to specific scenarios |
| Skills | Limits to specific skills |
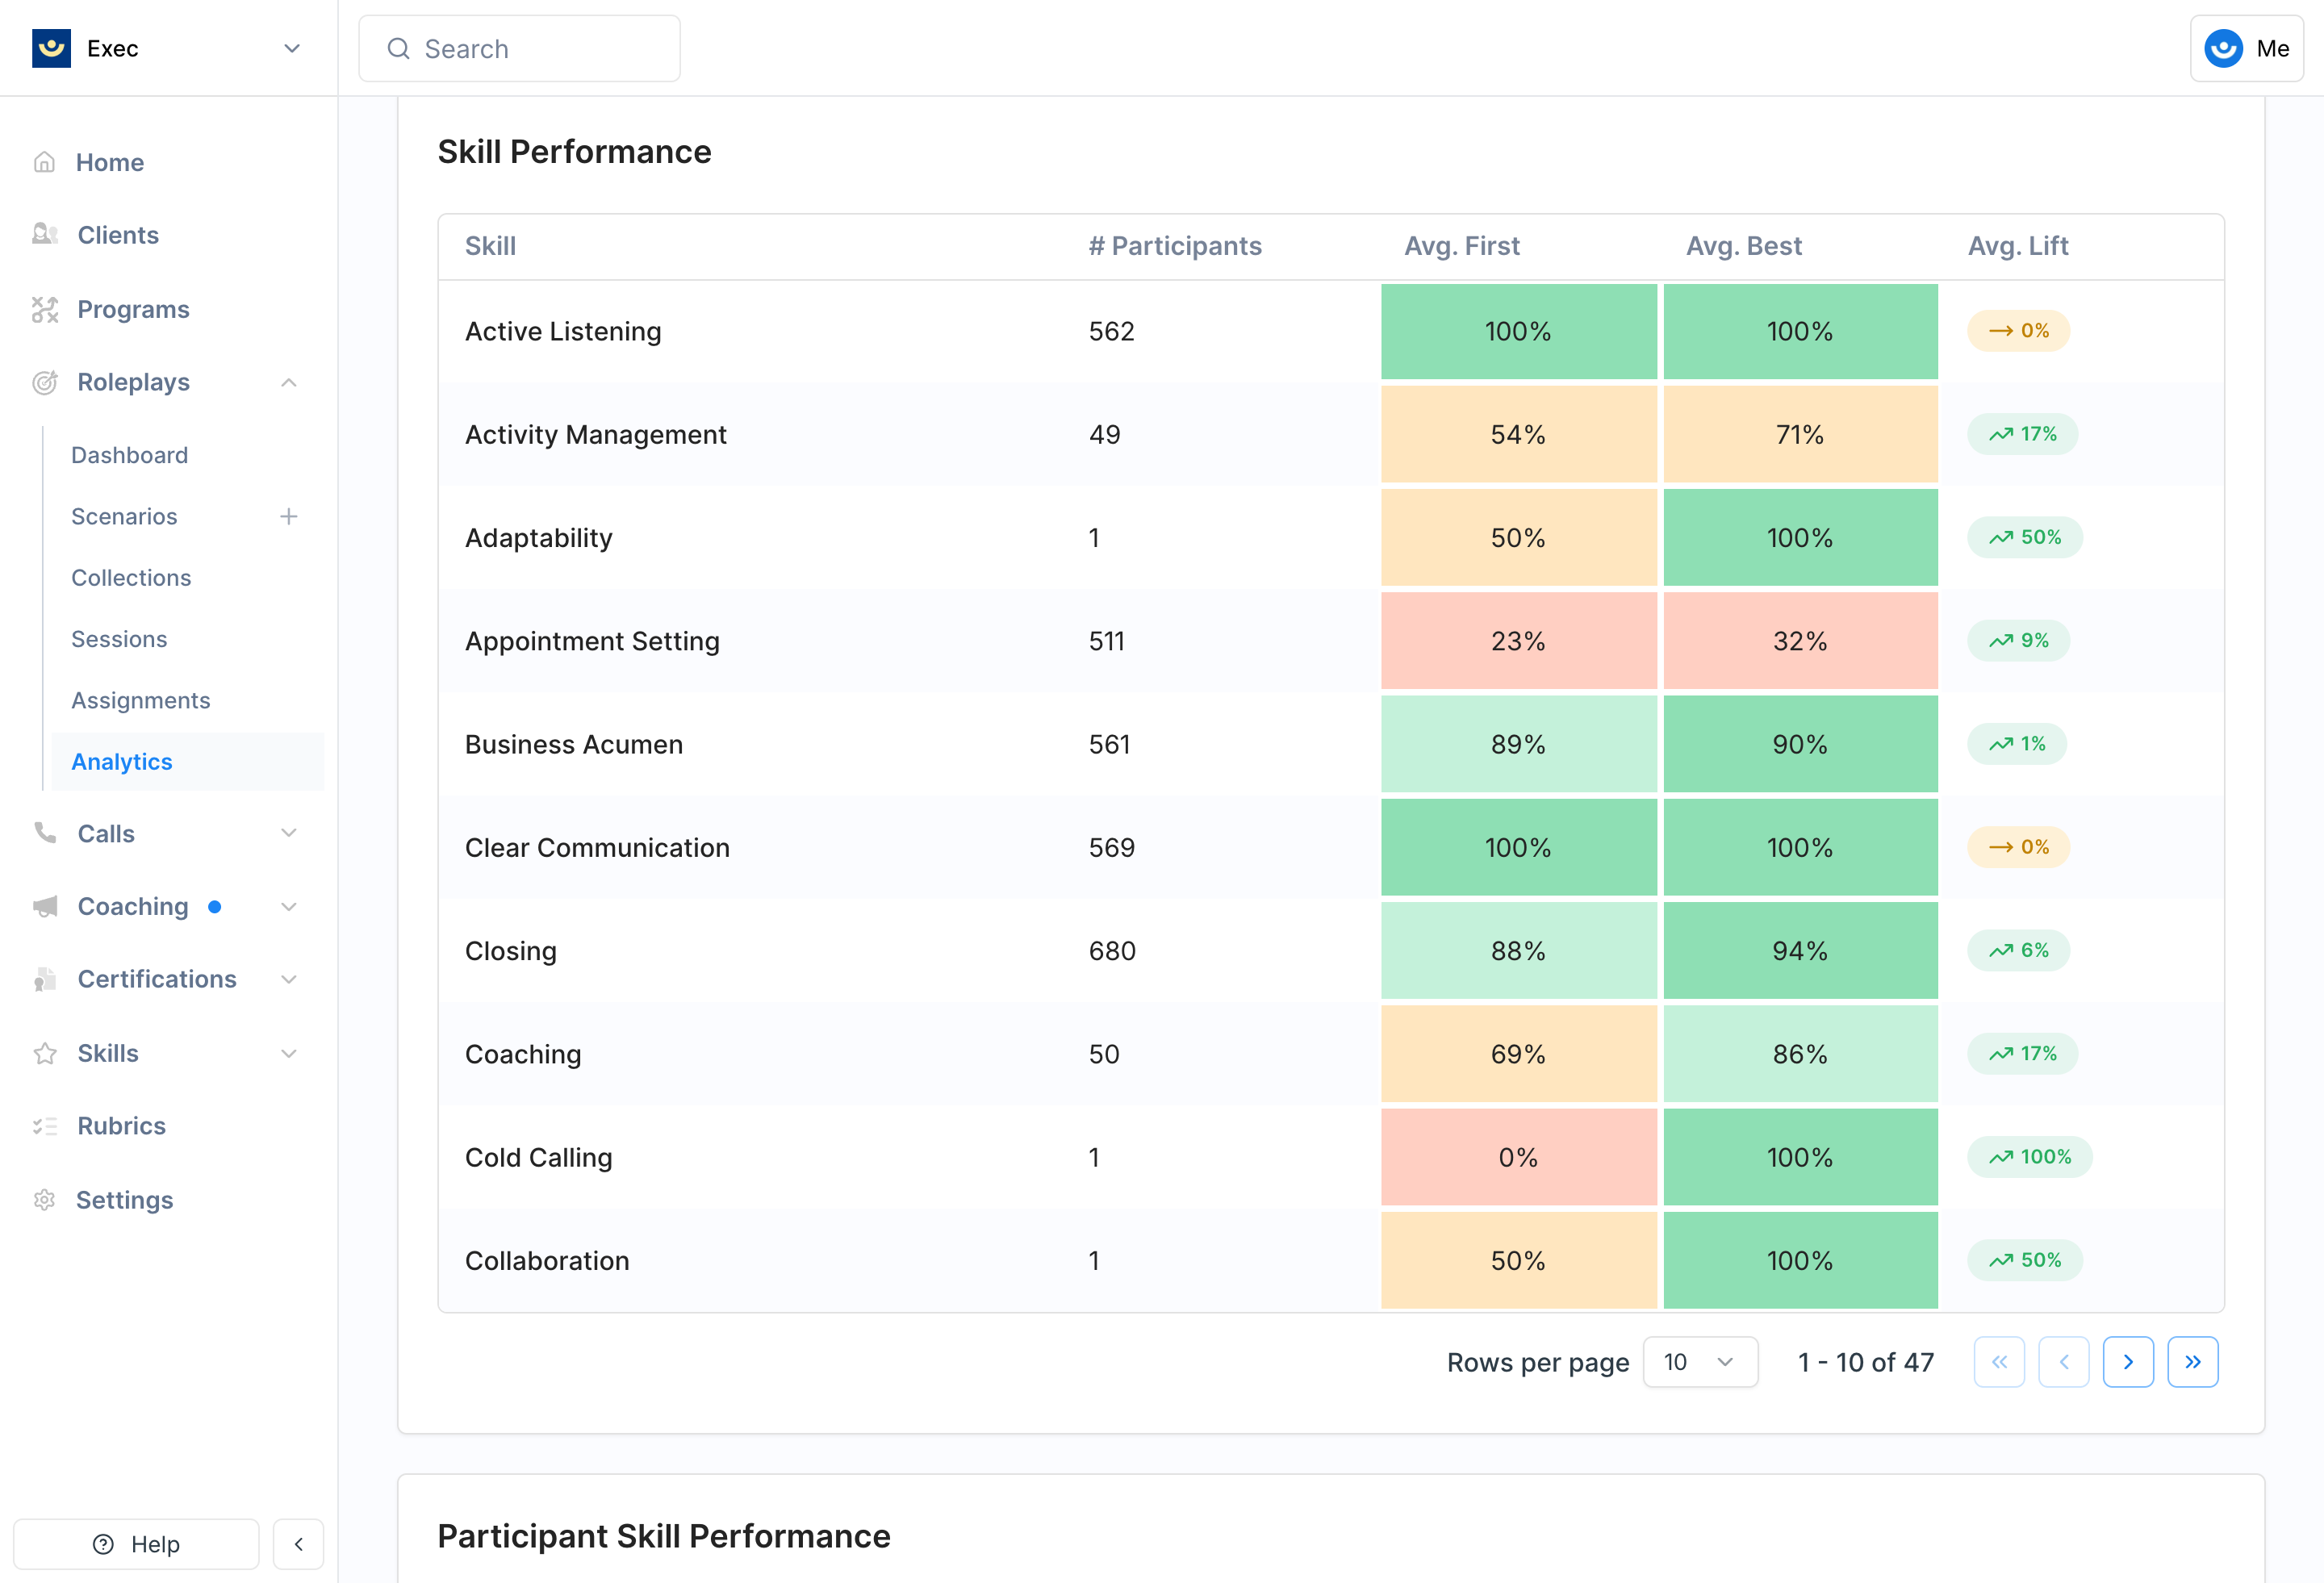
Skill Performance Table
Shows one row per skill with aggregate metrics across all participants in your filtered view.| Column | What It Shows |
|---|---|
| Skill Name | Click to open the skill drilldown |
| # Participants | Count of people with sessions for this skill |
| Avg. First | Average first-session score across participants |
| Avg. Best | Average best score across participants |
| Avg. Lift | Average improvement (participants with 2+ sessions only) |
Skill Drilldown
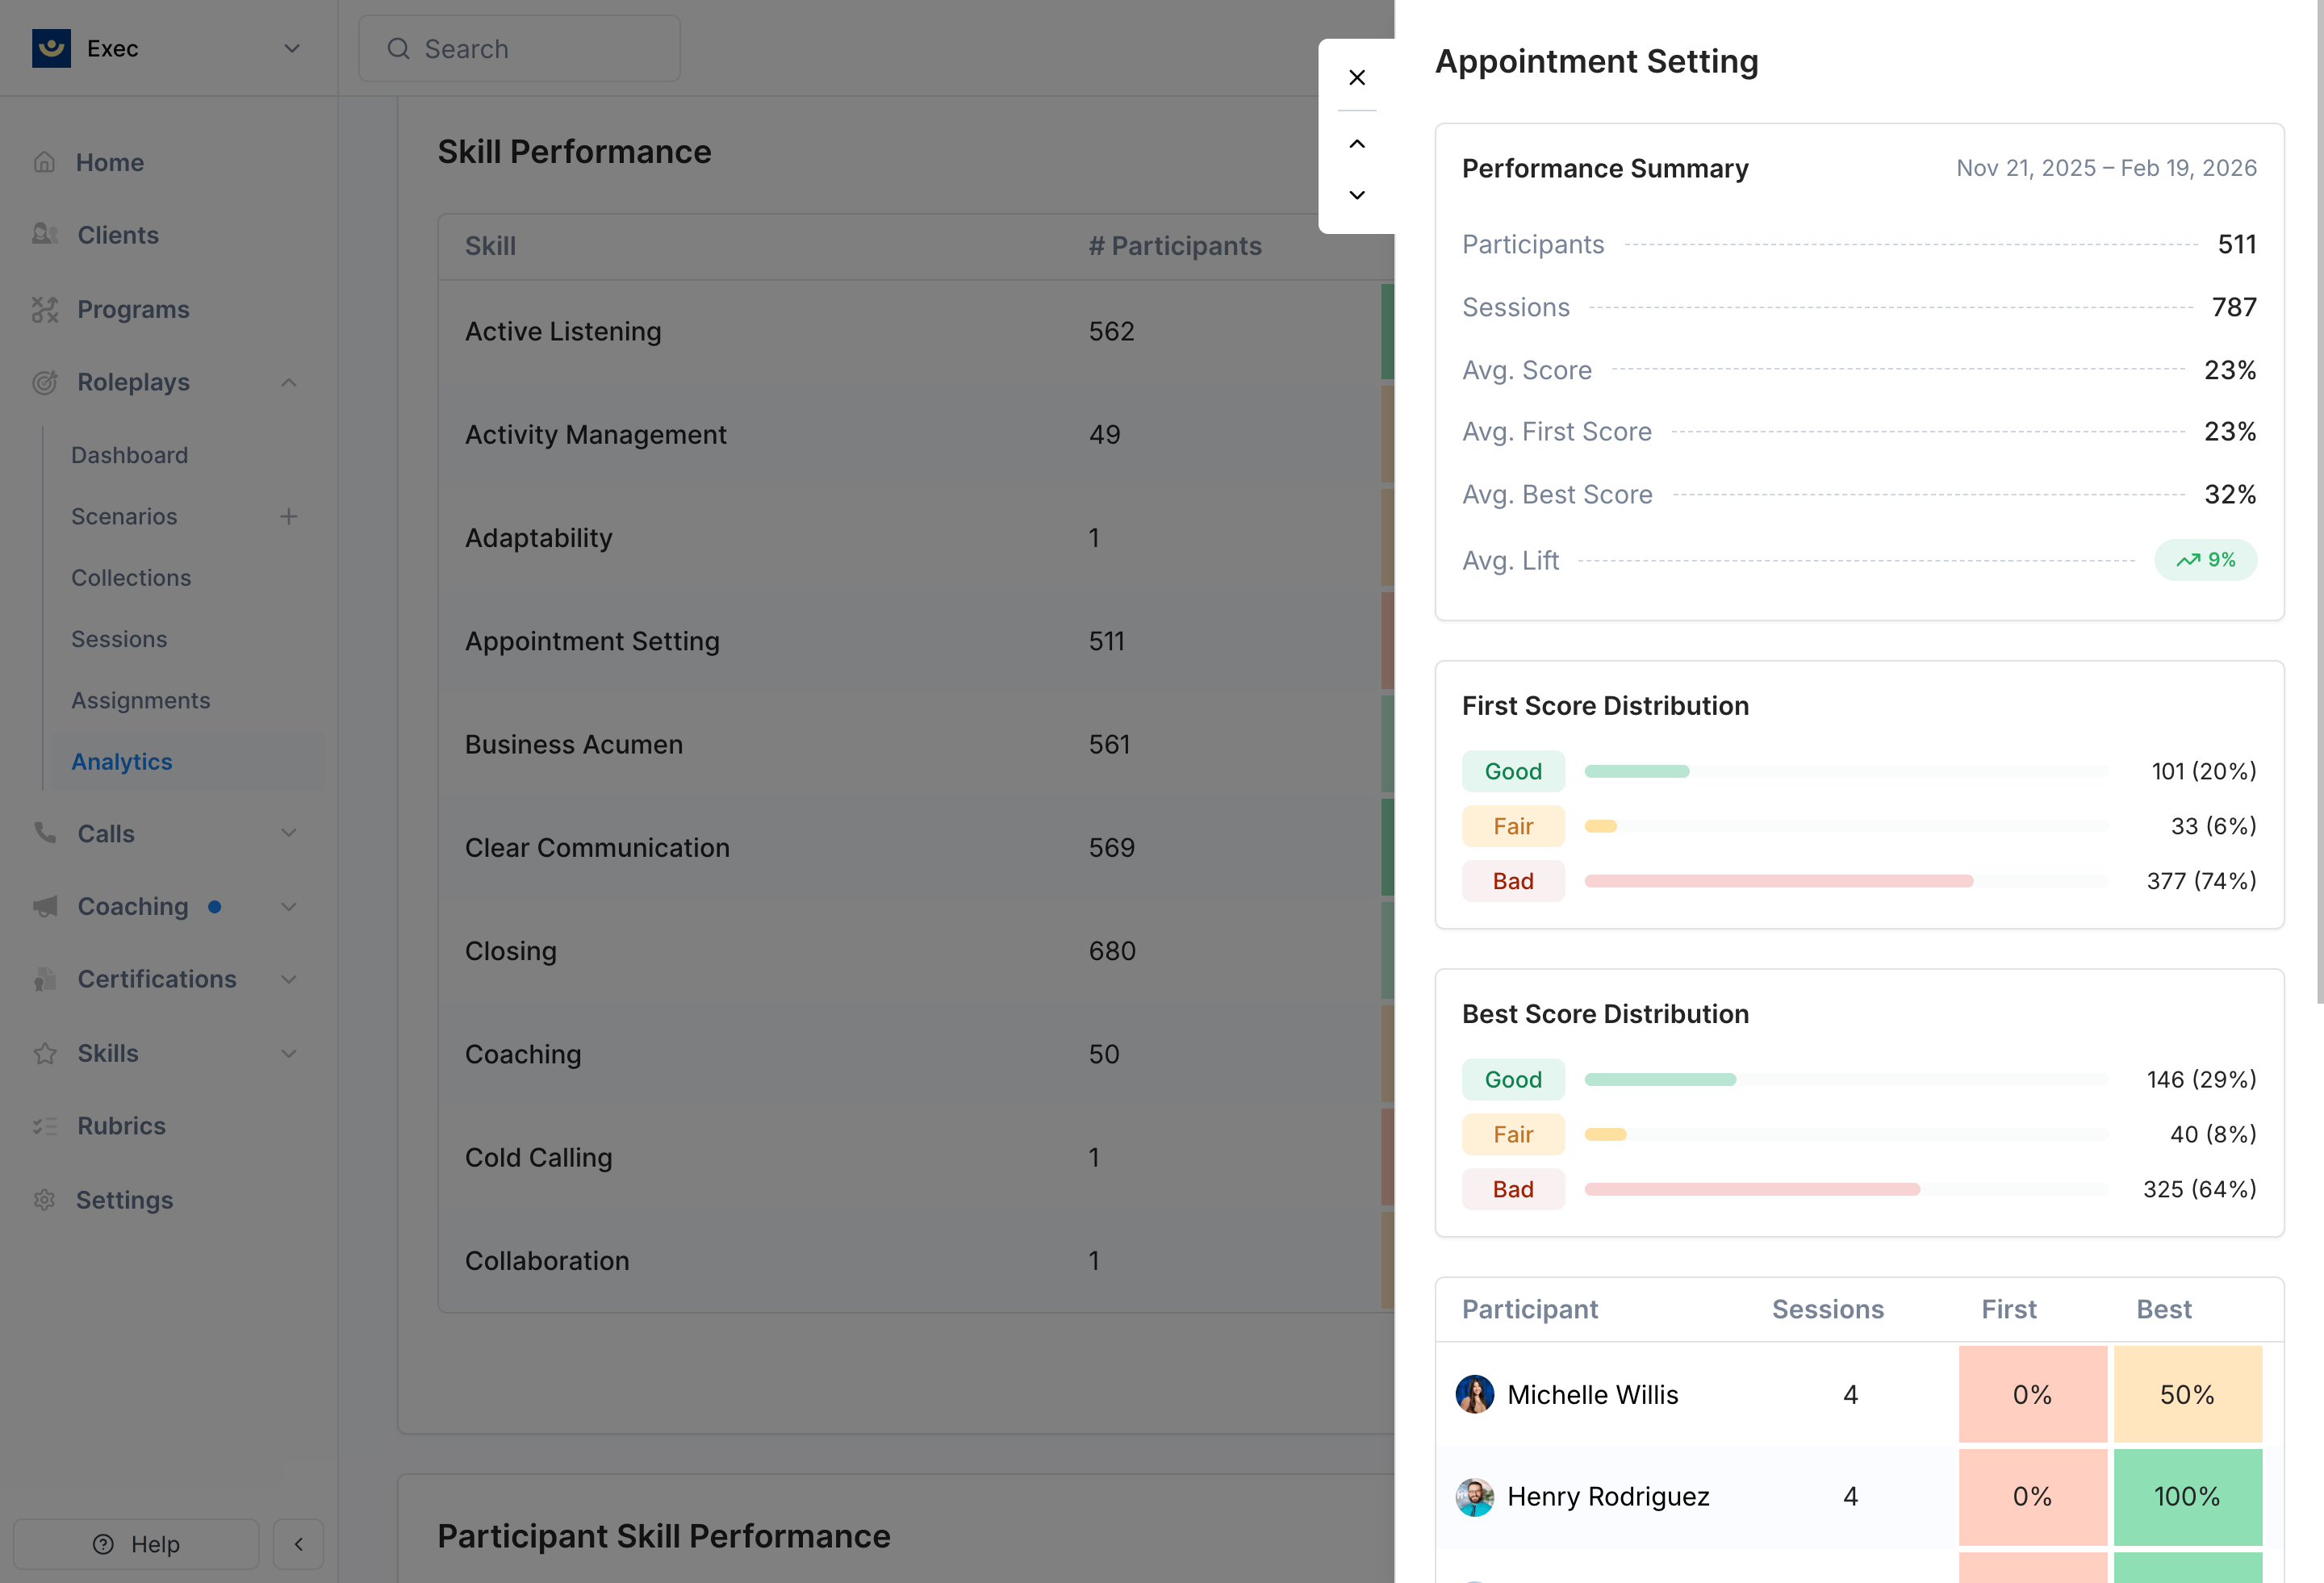
- Performance summary — Total participants, total sessions, average score, first, best, and lift
- First Score Distribution — Bar chart showing how many participants’ first scores fell into each tier (Good, Fair, Needs Improvement)
- Best Score Distribution — Same format for best scores
- Participant table — Each person’s session count, first score, best score, and lift. Sortable by any column. Default sort surfaces who needs the most attention.
User × Skill Heatmap
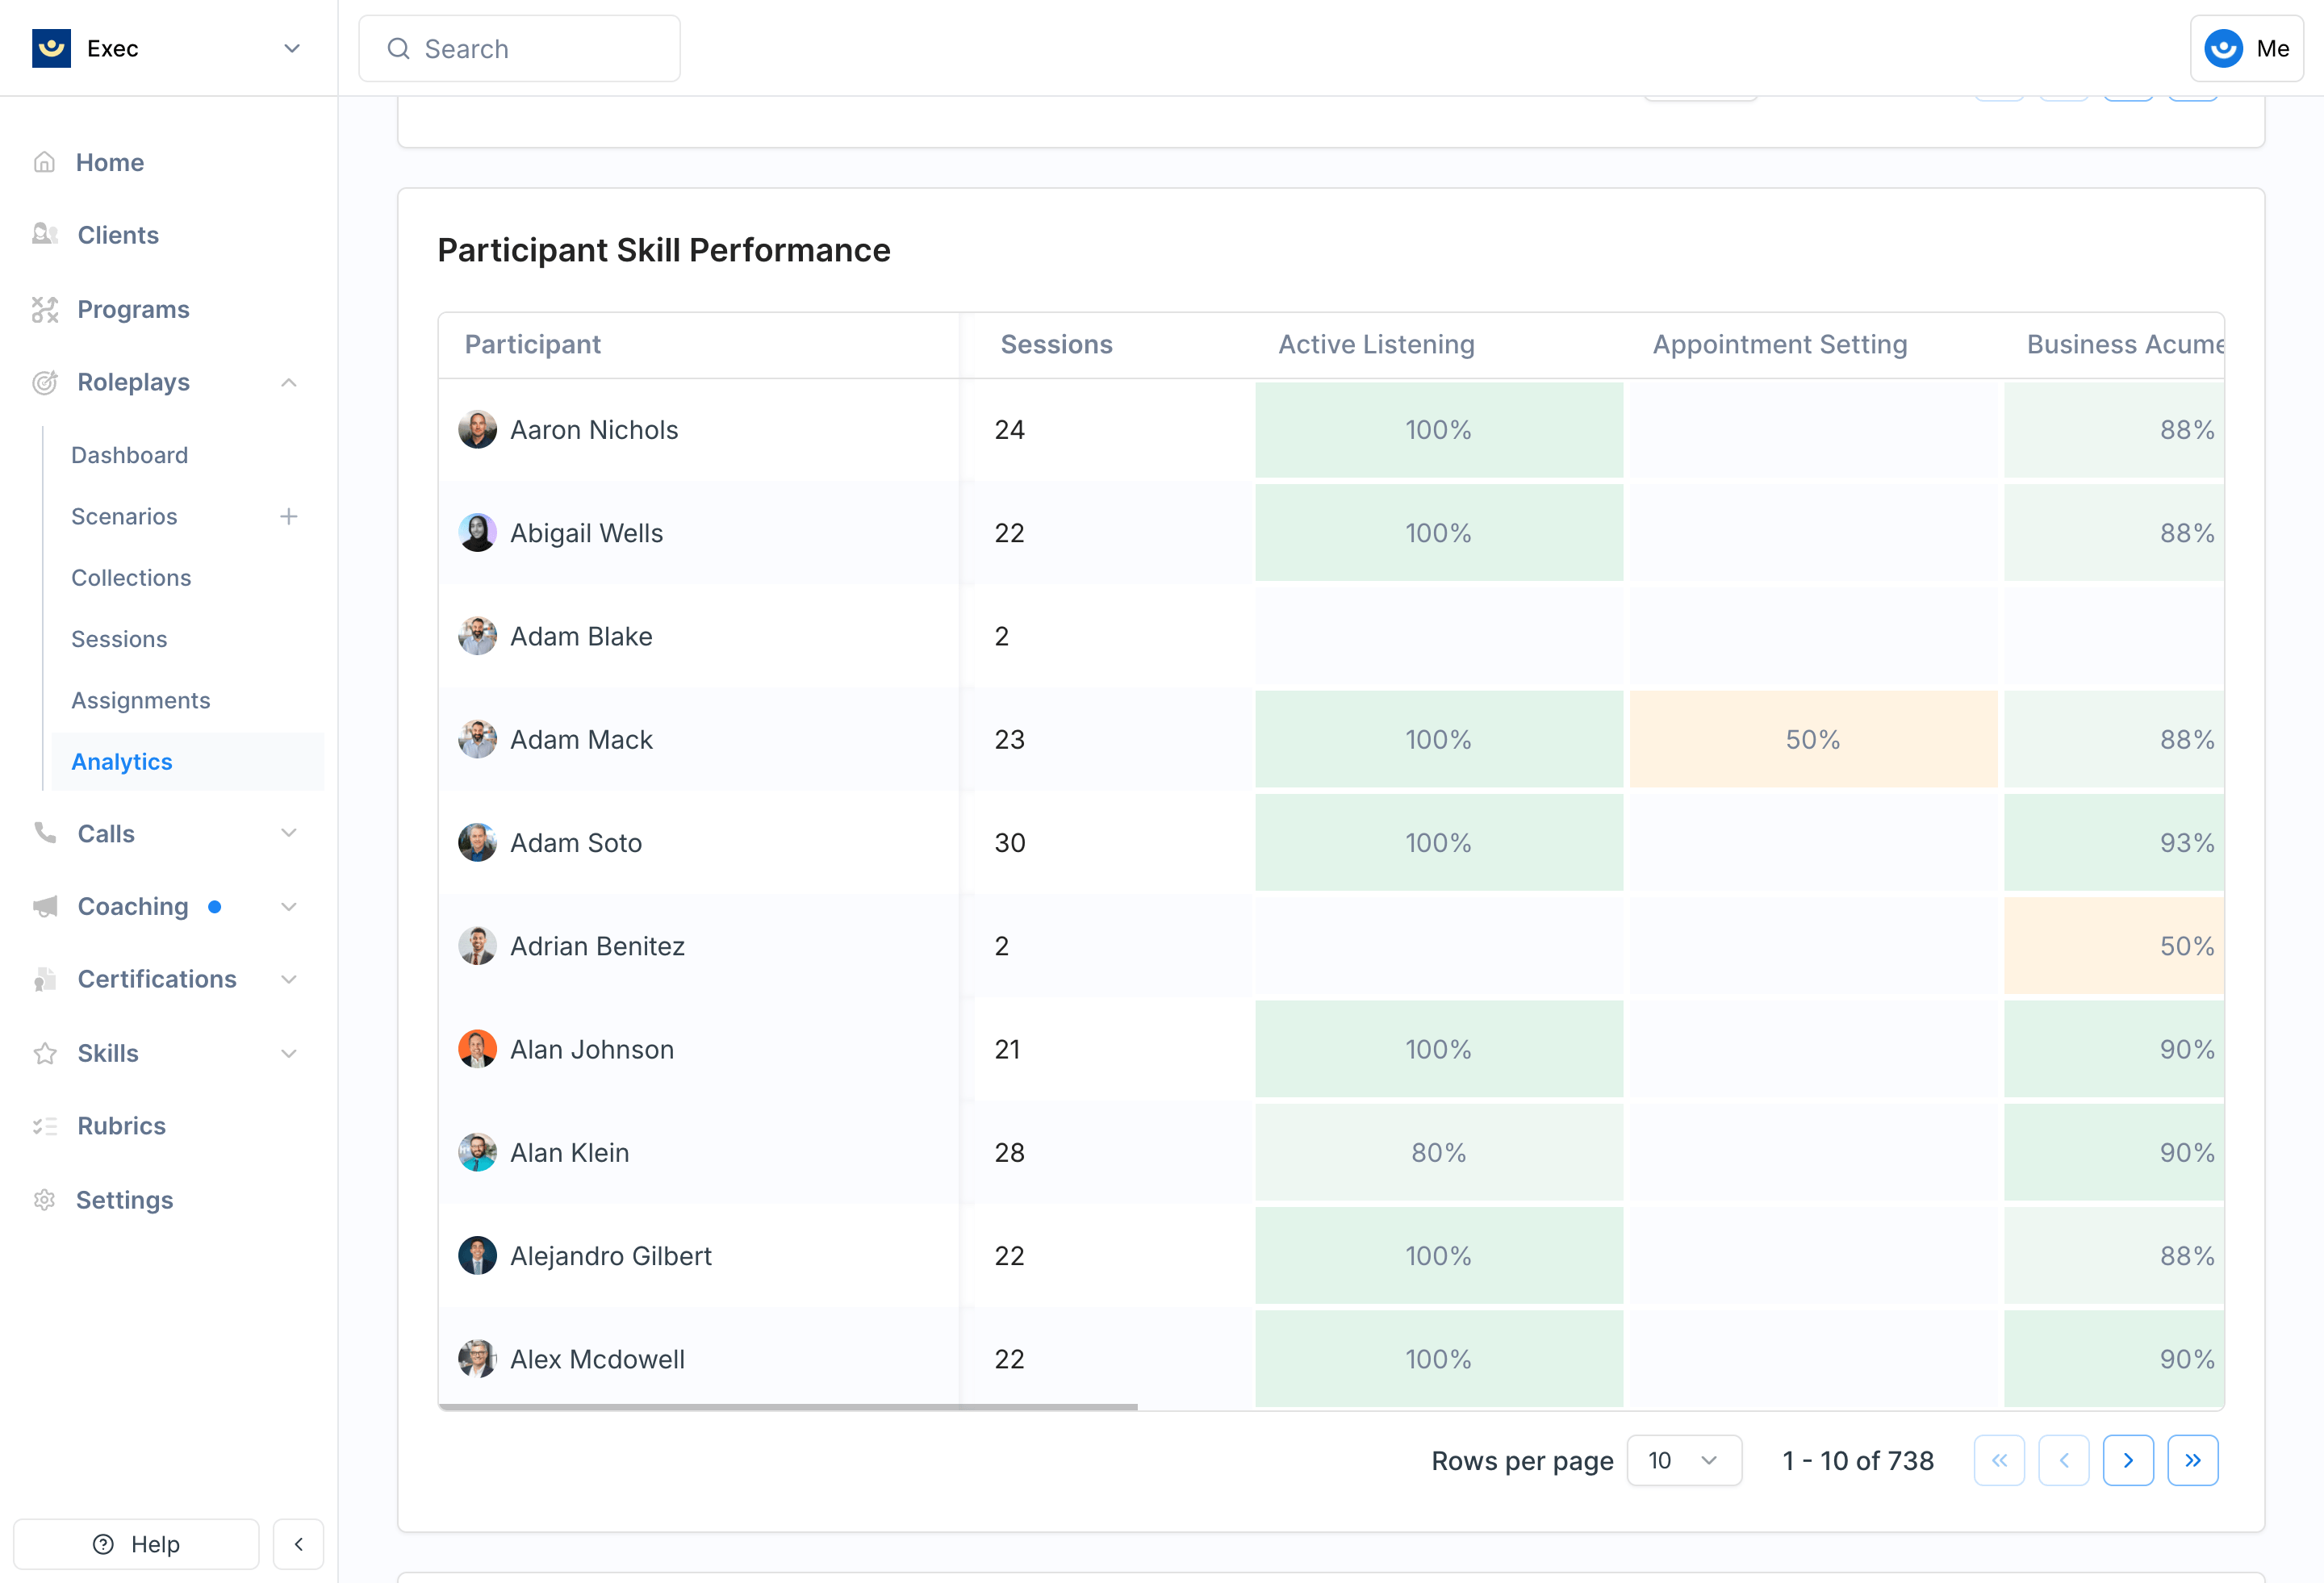
- Rows — Participants (with avatar and total session count)
- Columns — Skills (loads more as you scroll right)
- Cells — Color-coded by average score, displaying the rounded percentage
Heatmap Drilldown
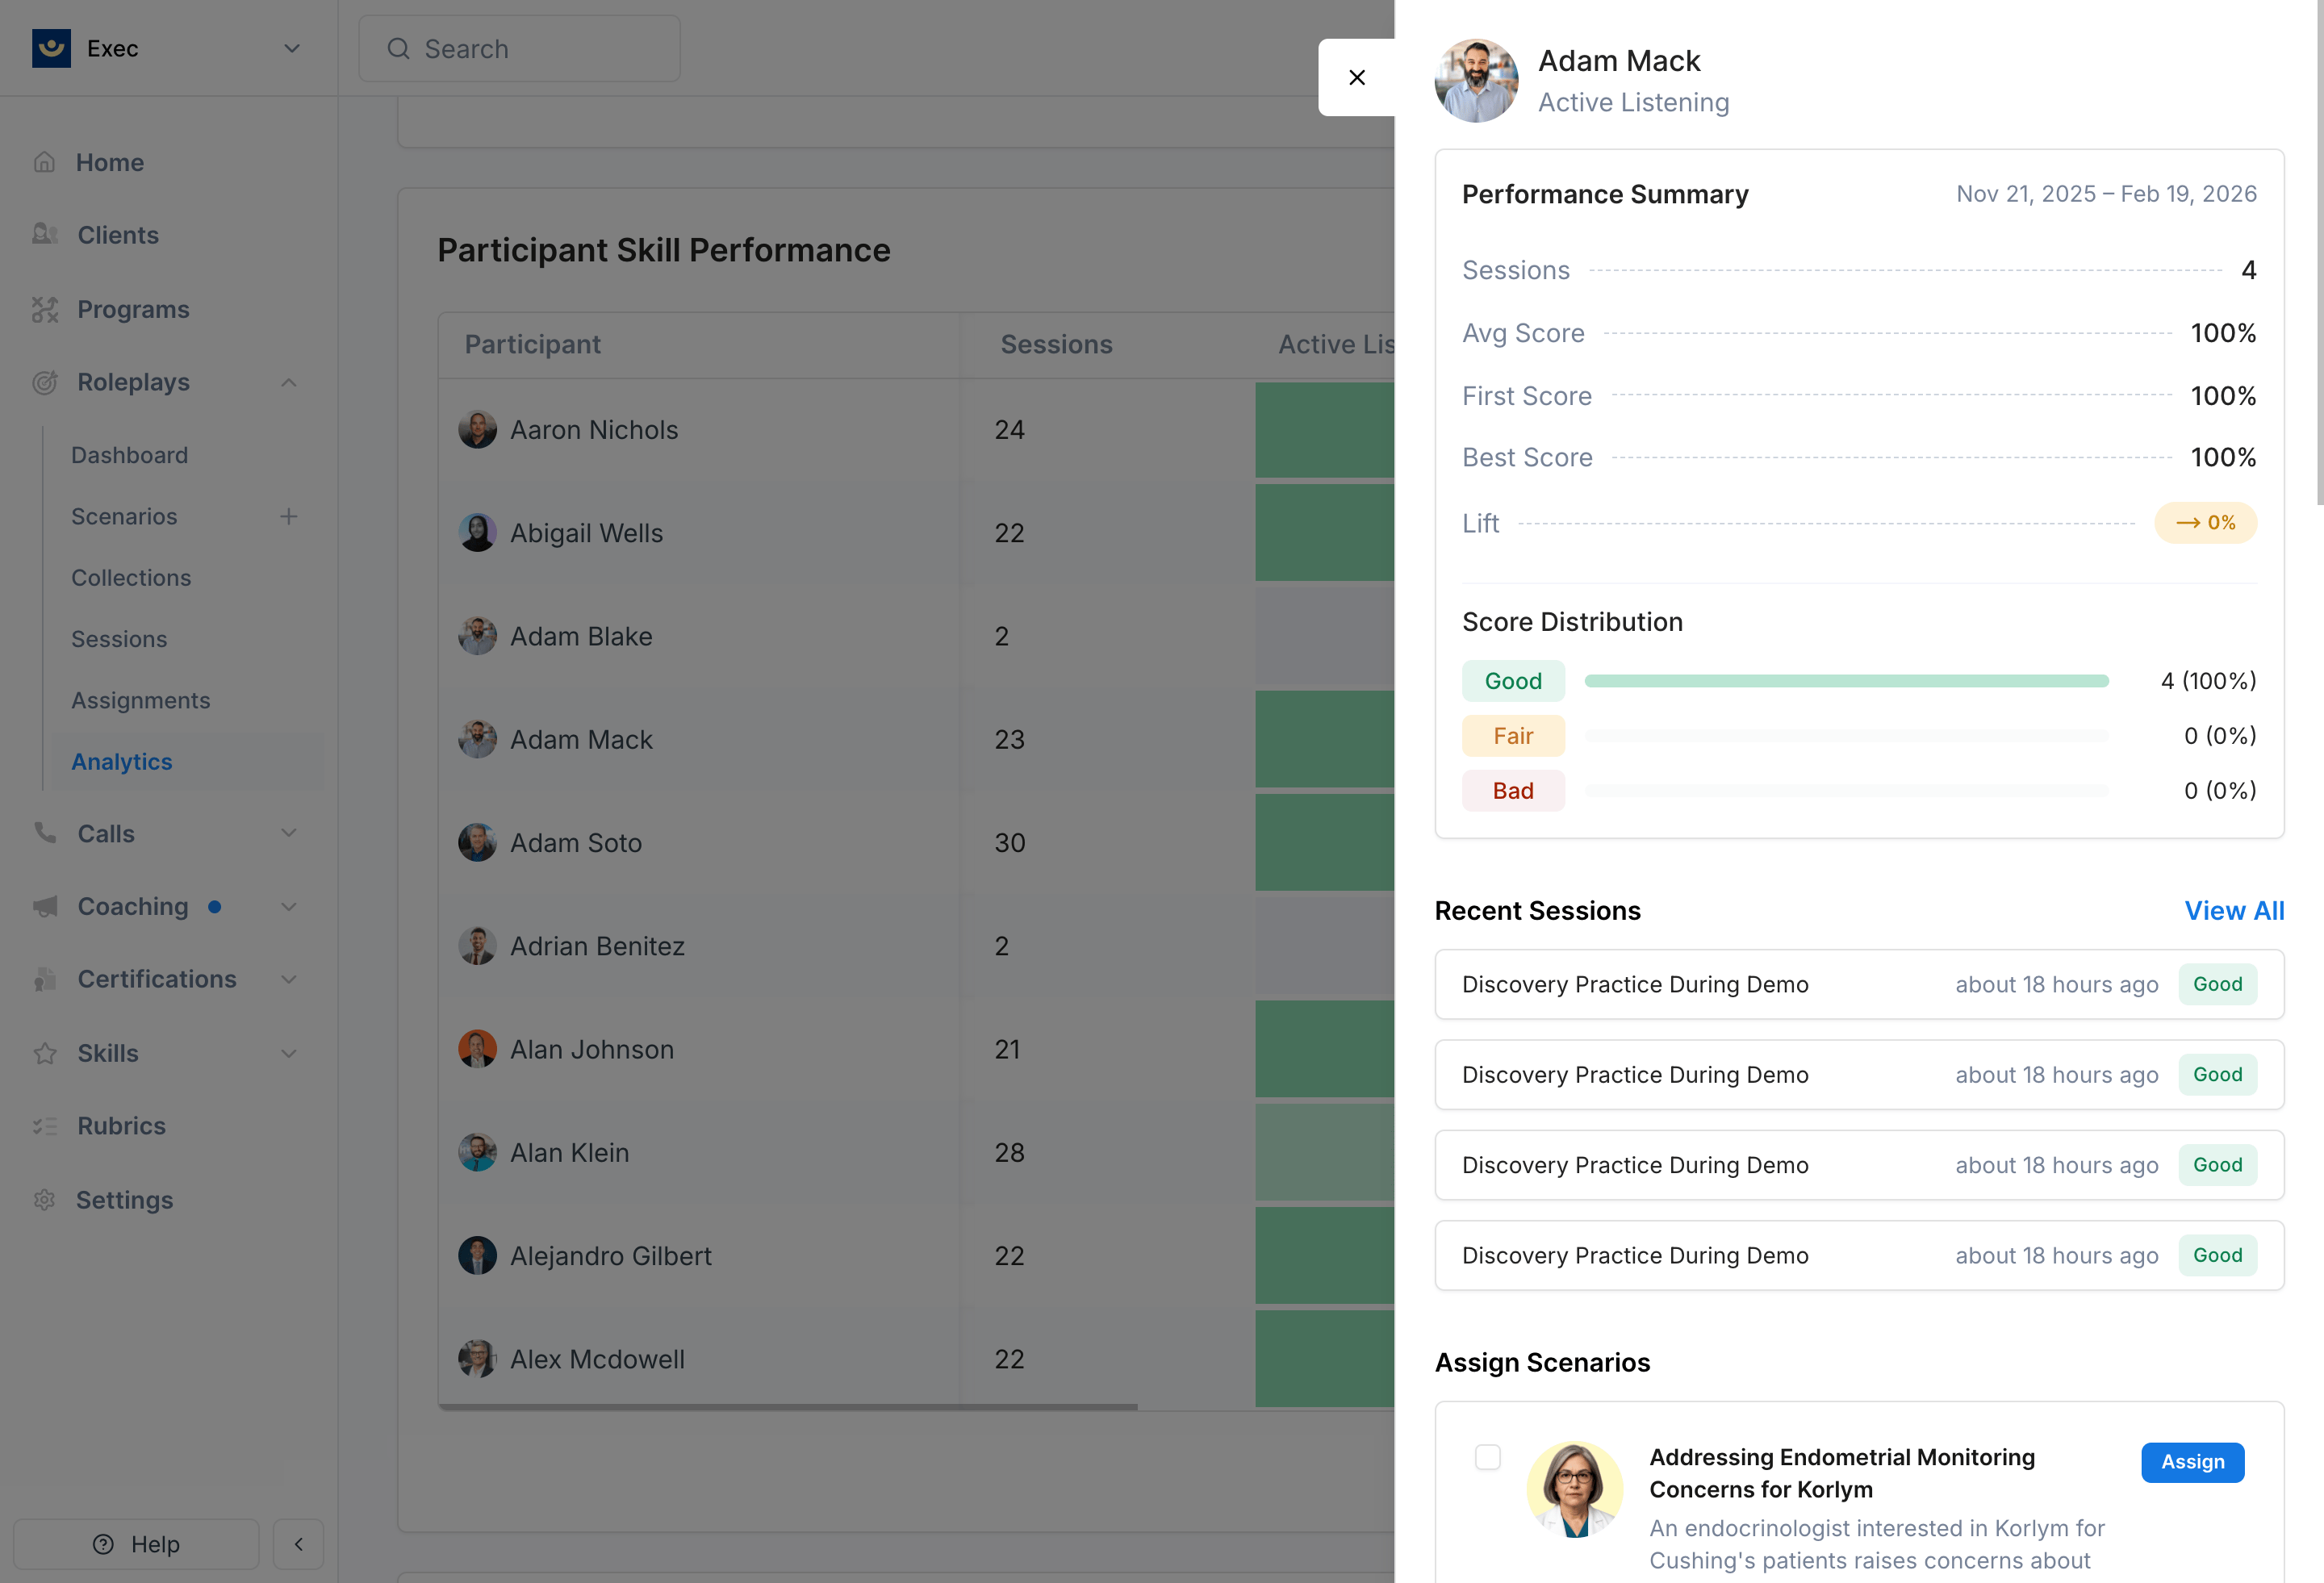
- Performance summary — Sessions, average score, first, best, lift, and score distribution
- Recent sessions — The 5 most recent sessions with scenario name, time, and score badge. Click any to view the full session detail.
- Assign Scenarios — Scenarios tagged with this skill. Select one or more and click Assign to send them directly to the participant.
Scenario-Specific Analytics
When you view analytics on a specific scenario page, the same skill performance views appear but are automatically scoped to that scenario. Navigate to your scenario and click the Analytics tab.Evaluation Criteria Heatmap
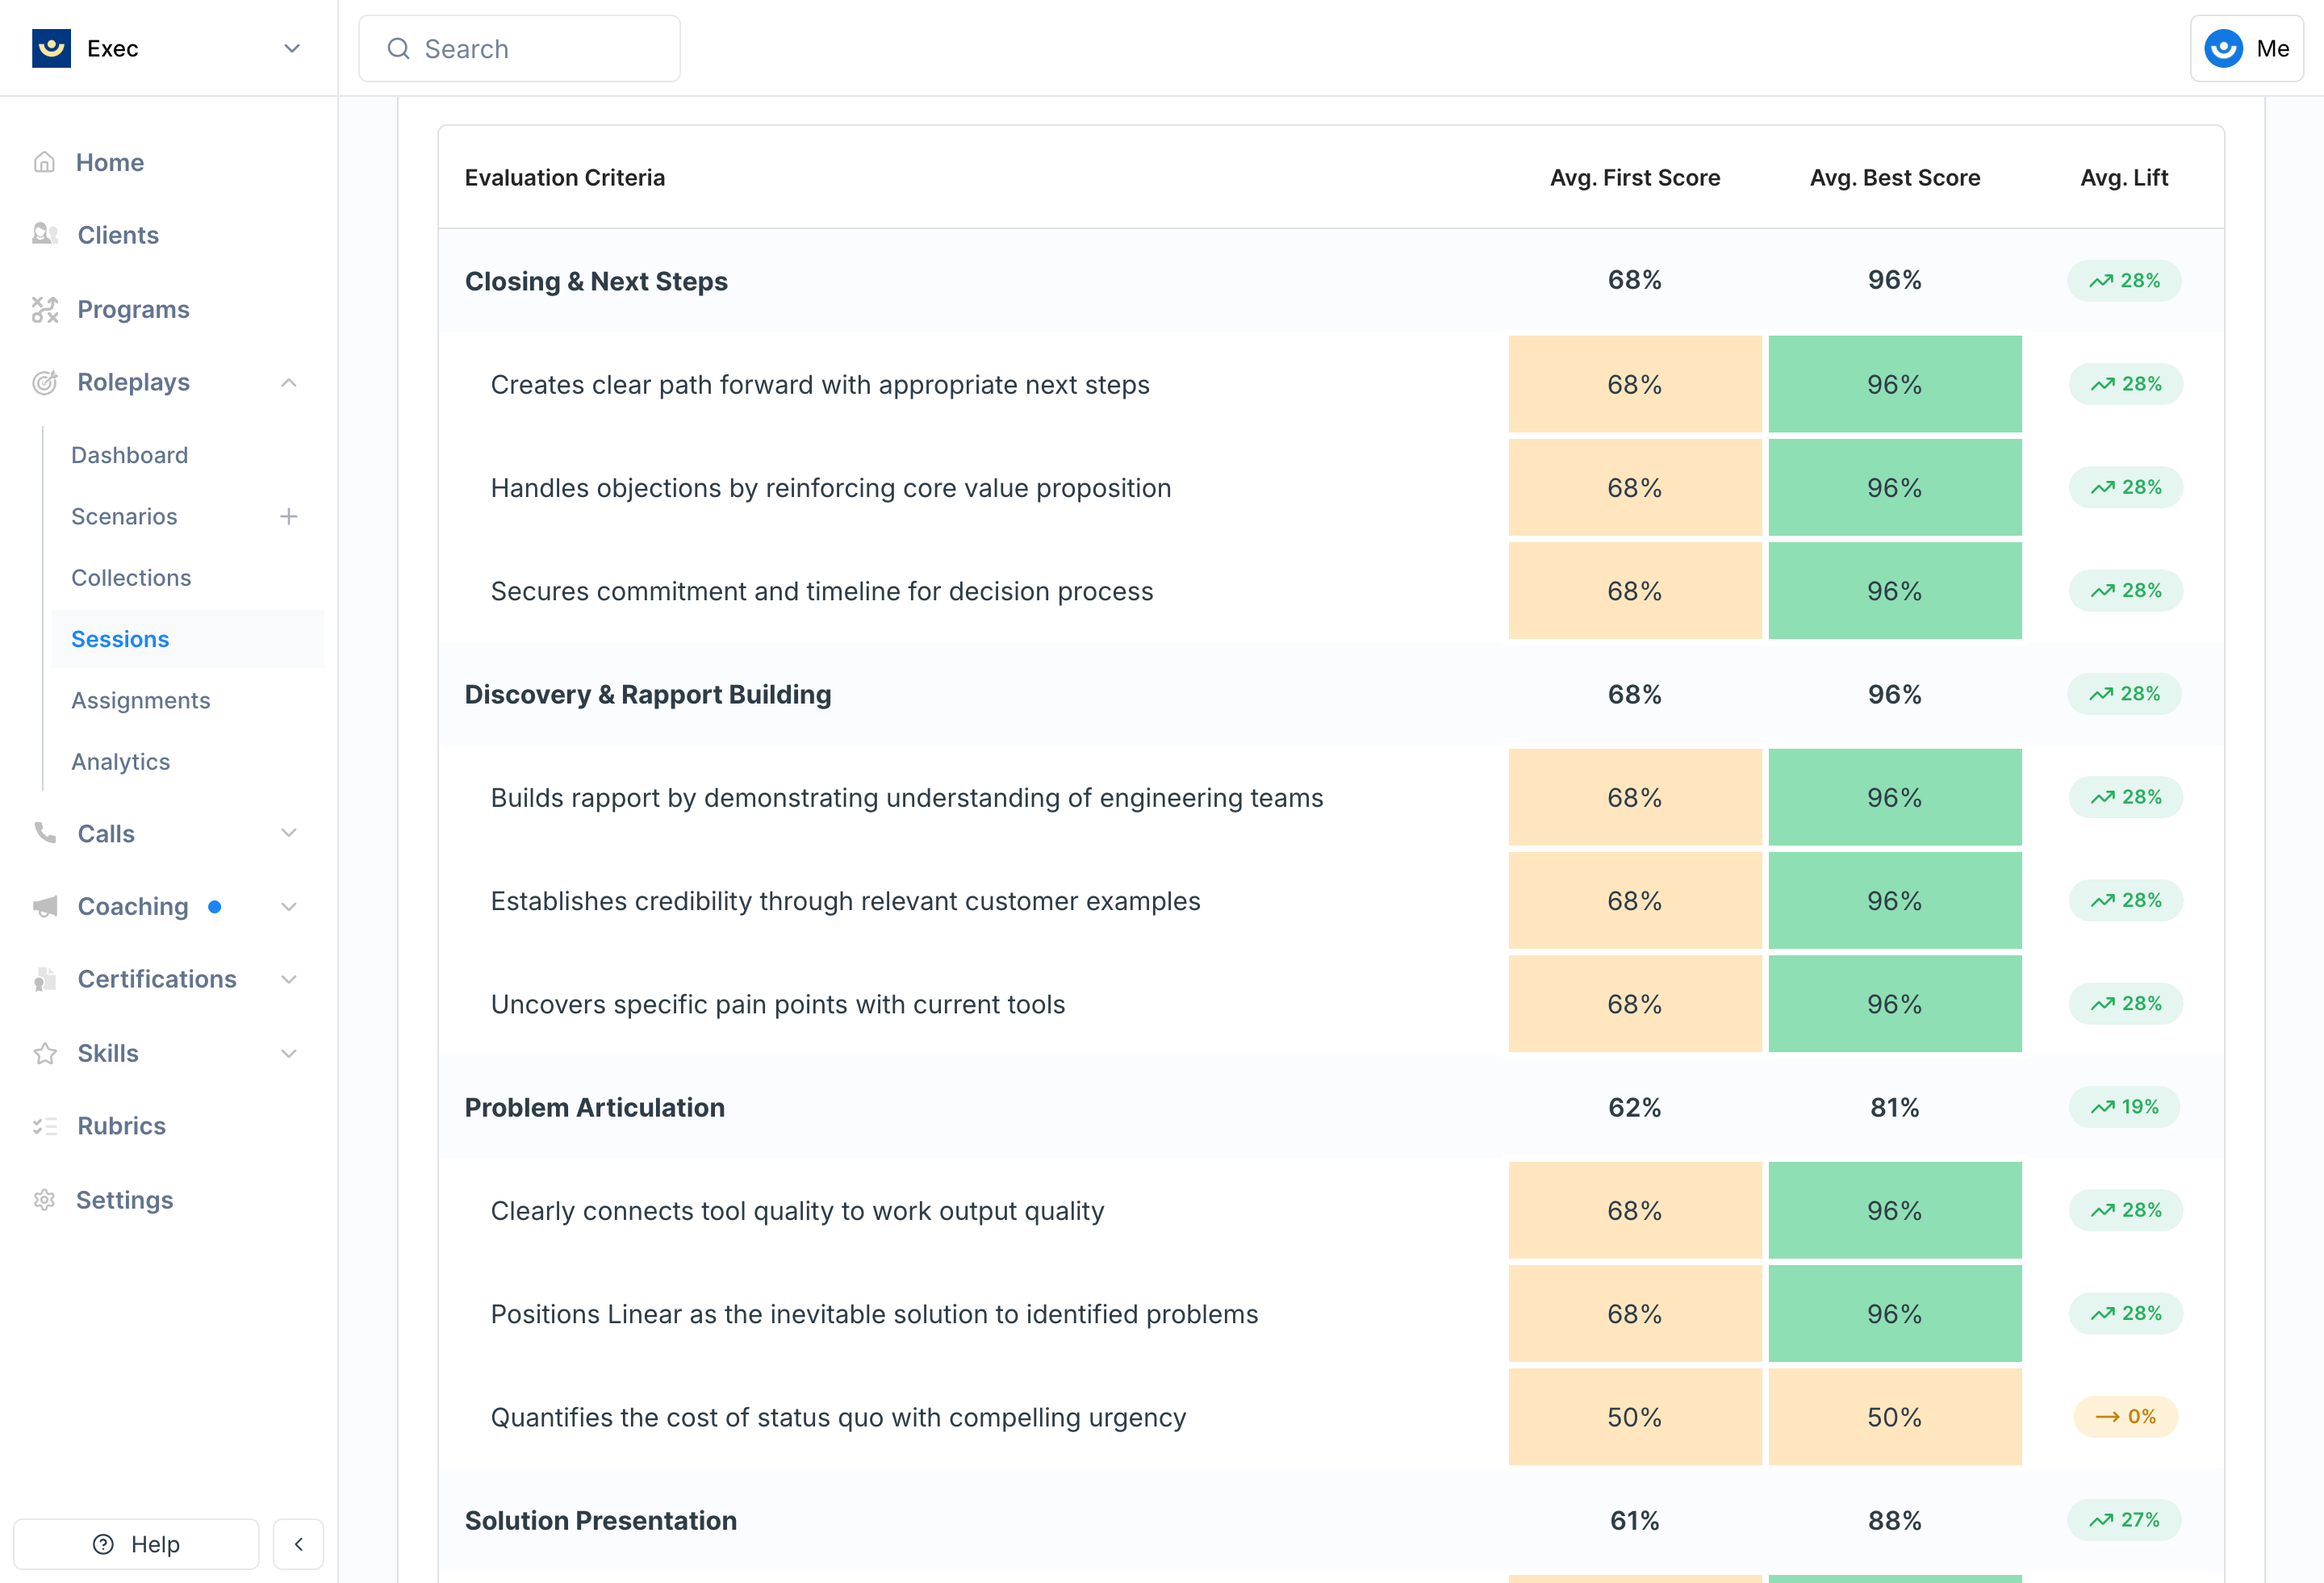
- Grouped by criterion (rubric section headers)
- Each criterion row shows Avg. First Score, Avg. Best Score, and Avg. Lift
- Criterion items appear as nested rows with the same metrics
Skill Performance in Call Analytics
Call Analytics provides the same skill performance views as Roleplay Analytics, with a few differences.- Participants vs. Users — Call analytics uses “participants” because people on calls may not have Exec accounts
- Call Categories vs. Scenarios — Filter by call category instead of scenario
Call Analytics Filters
Call Analytics Filters
| Filter | What It Does |
|---|---|
| Date Range | Limits to calls within a specific time period |
| Call Categories | Limits to specific call types |
| Users / Participants | Limits to specific people |
| Groups | Limits to members of selected groups |
| Skills | Limits to specific skills |
To find skill information for Calls, head to Calls -> Dashboard, then click on the category that you’d like to view skills in. Scroll until you see Skill Performance.
Score Attribution
How call skill scores are attributed to participants depends on how the scoring rubric is configured per criterion item:Speakers
Speakers
Only participants who spoke during the relevant portion of the call receive the score. The most precise attribution method.
All Participants
All Participants
All internal participants receive the score regardless of who spoke. Useful for criteria that apply to the whole team (e.g., “Meeting was well-structured”).
No Attribution
No Attribution
The score is tracked at the call level only and is not attributed to any individual. It contributes to aggregate call analytics but doesn’t affect individual skill tracking.
Attribution is configured per criterion item in the scoring rubric, not per call. If you’re not seeing expected skill data for specific participants, check the attribution settings on the relevant criterion items.