> ## Documentation Index
> Fetch the complete documentation index at: https://docs.exec.com/llms.txt
> Use this file to discover all available pages before exploring further.
# Skill Proficiency and Reports
> Measure long-term skill development with proficiency scores and custom reports
Proficiency gives you a stable, big-picture view of how skilled someone is. Unlike [performance metrics](/skills/analyze-performance) — which reflect specific filtered sessions — proficiency is a person-level measure that combines all recent data from roleplays and calls, weighted so that recent activity matters most.
***
## How Proficiency Works
Proficiency is a weighted average of all scored observations within the last 180 days. Recent activity carries more influence than older activity, keeping the score focused on current capability while still incorporating historical context.
Proficiency uses a **30-day half-life**. An observation from 30 days ago carries about half the weight of one from today; one from 60 days ago carries about a quarter. This means proficiency naturally stays current — when someone improves, their score reflects it quickly.
Key details:
* Proficiency combines data from **both AI roleplays and scored calls** — it measures capability regardless of how someone practiced.
* Proficiency **does not change based on analytics filters**. It always reflects the full picture.
***
## Proficiency Tiers
| Tier | Score Range | What It Means |
| :-------------------- | :----------- | :--------------------------------------------- |
| **Excellent** | 90 and above | Consistently demonstrates mastery |
| **Proficient** | 75–89 | Solid, reliable capability |
| **Developing** | 50–74 | Building competency, showing progress |
| **Needs Work** | Below 50 | Requires focused development |
| **Insufficient Data** | — | Fewer than 3 observations in the last 180 days |
***
## Proficiency Lift
Lift measures how much a person's proficiency has improved over time by comparing their earliest proficiency (from their first few observations) to their current score.
* **Positive lift** — improvement over time
* **Negative lift** — recent performance trending lower than earlier performance
* Lift requires 2+ separate sessions to calculate. Otherwise it shows as "—".
***
## Viewing Proficiency on the Skills Page
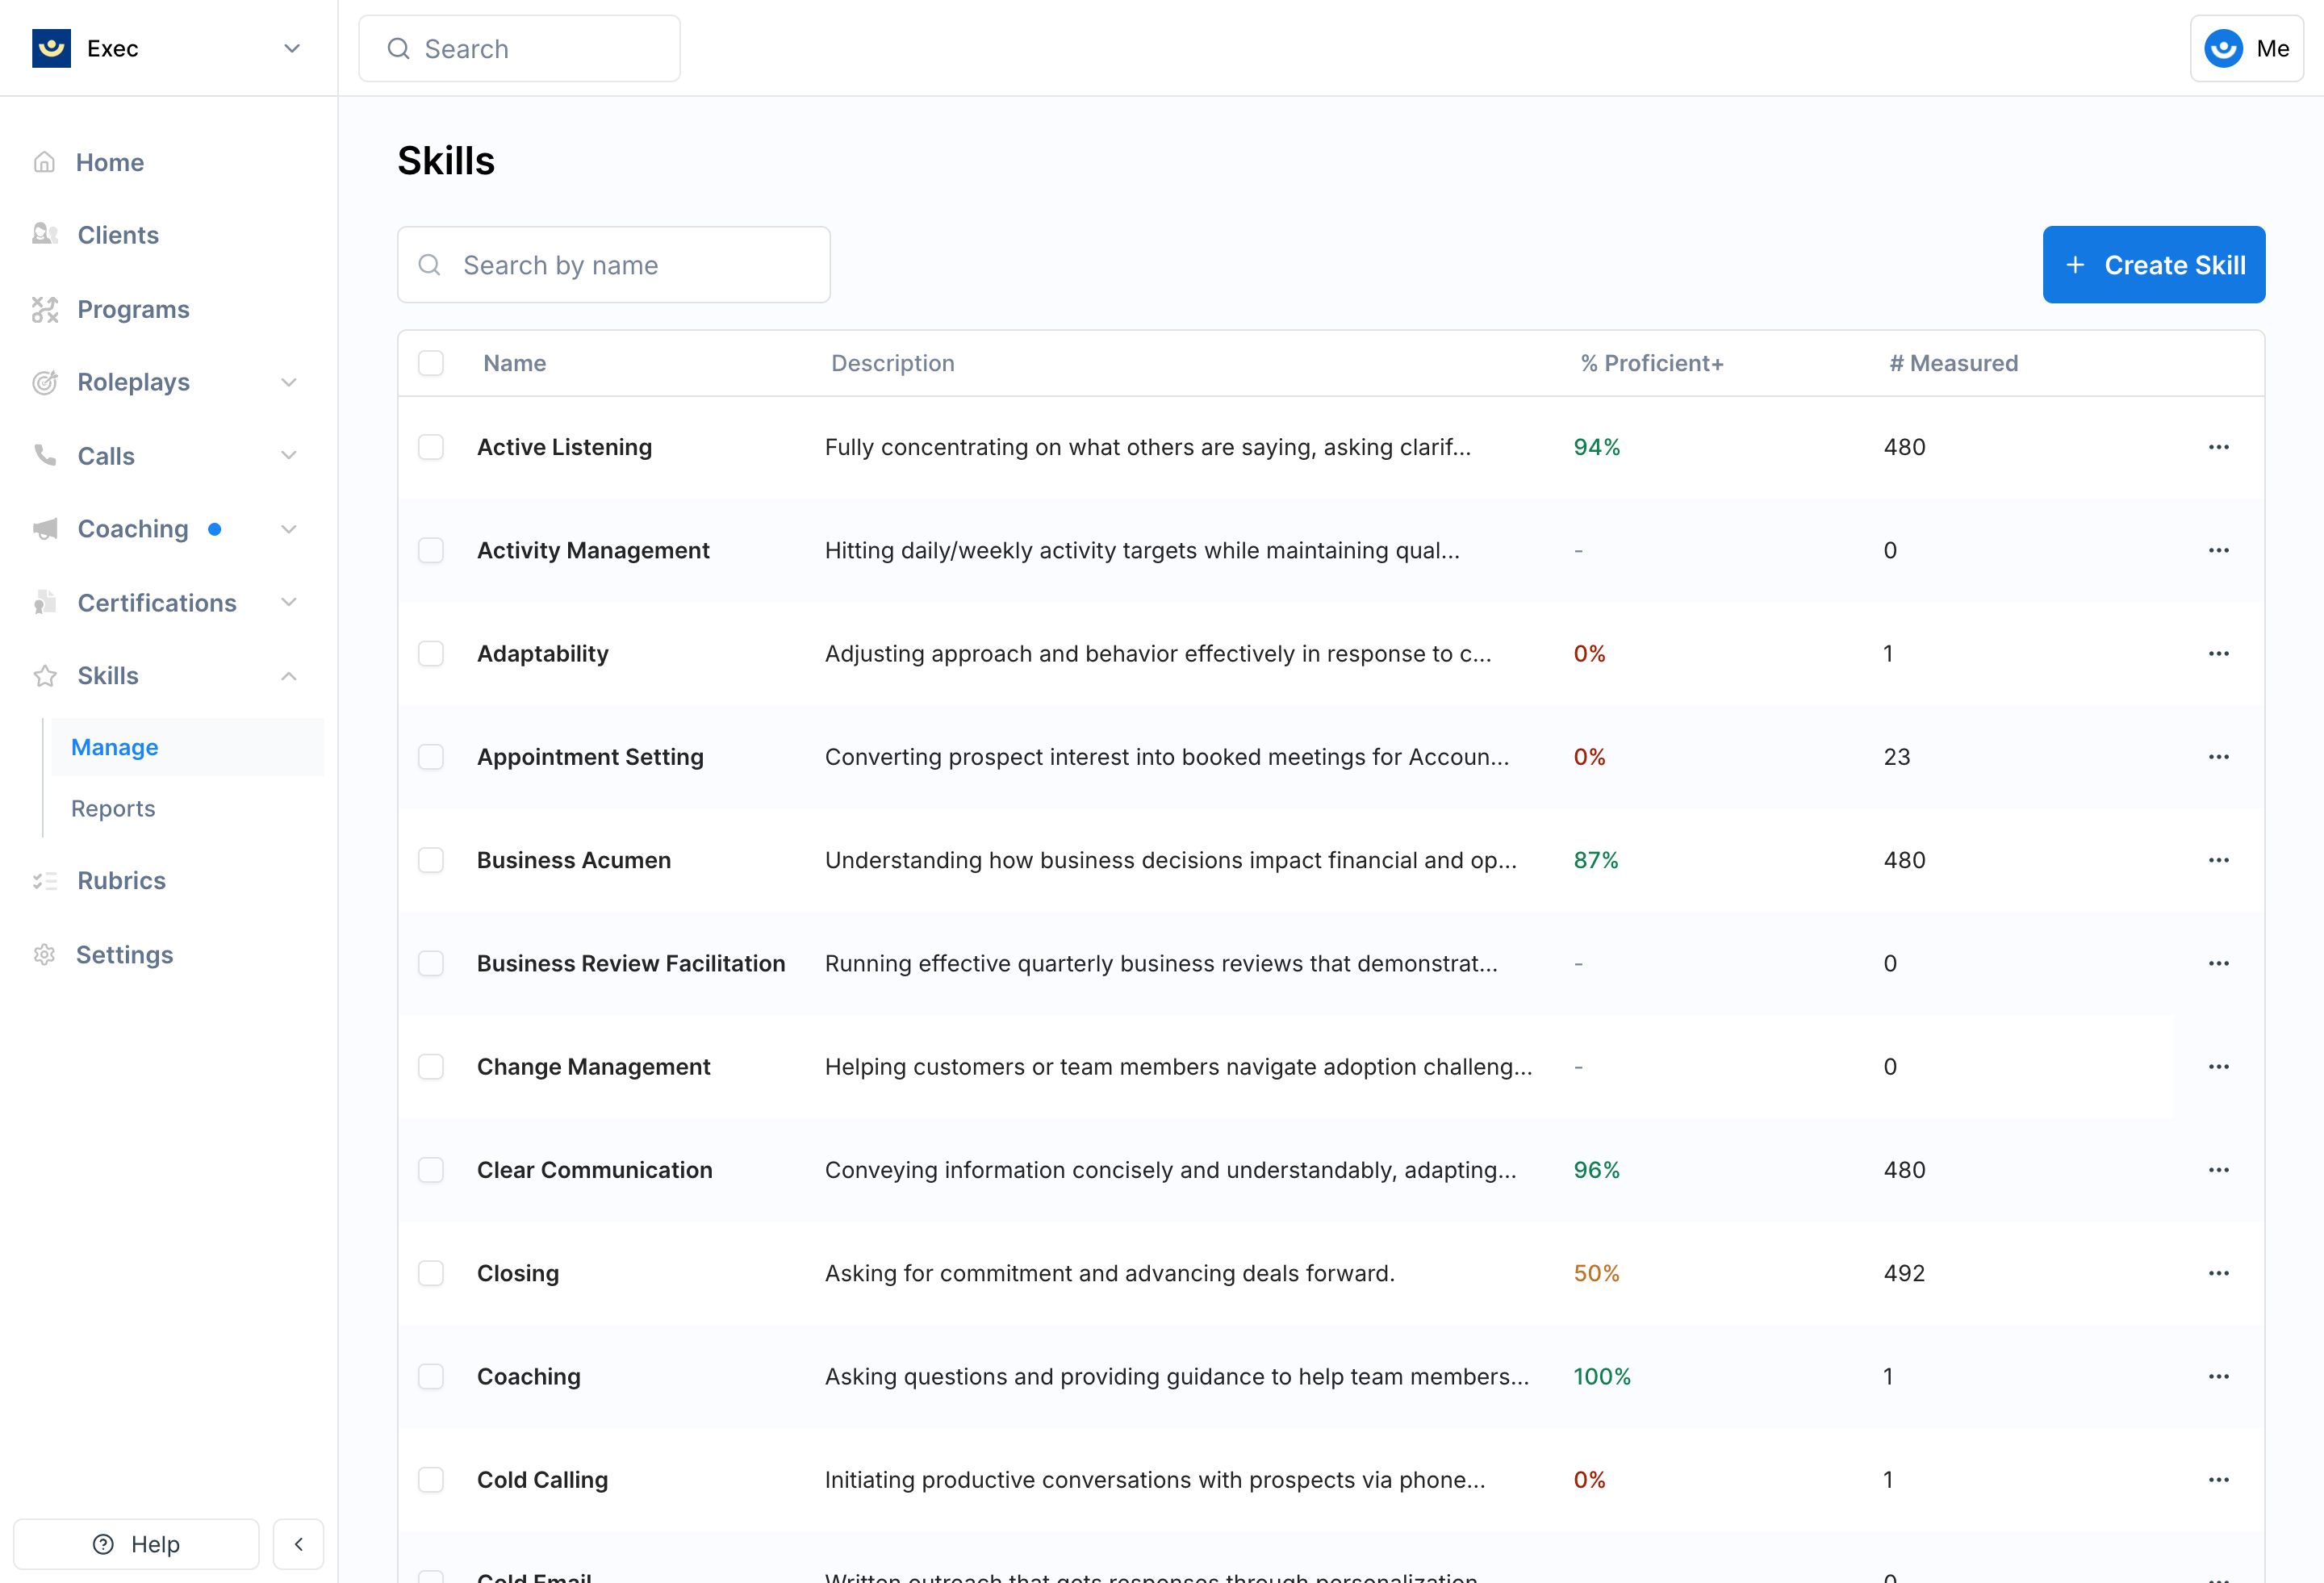 The Skills management table (accessible from **Skills** in the left sidebar) shows two proficiency-related columns per skill:
* **% Proficient+** — percentage of measured participants at Proficient or Excellent tier
* **# Measured** — number of participants who have been scored on this skill
Click any skill row to open the **Workspace Skill Proficiency Drawer**, which shows:
* **Total Participants** — everyone observed on this skill
* **Avg. Proficiency** — weighted average across all scored participants
* **Total Observations** — sum of all observations feeding the calculations
* **Proficiency Distribution** — visual breakdown of participants at each tier
* **Avg. Proficiency Over Time** — line chart showing the workspace-wide trend, with lift if there are 2+ data points
* **Participants Table** — individual participants with their observation count and proficiency tier/score
***
## Building Skill Reports
The Skills management table (accessible from **Skills** in the left sidebar) shows two proficiency-related columns per skill:
* **% Proficient+** — percentage of measured participants at Proficient or Excellent tier
* **# Measured** — number of participants who have been scored on this skill
Click any skill row to open the **Workspace Skill Proficiency Drawer**, which shows:
* **Total Participants** — everyone observed on this skill
* **Avg. Proficiency** — weighted average across all scored participants
* **Total Observations** — sum of all observations feeding the calculations
* **Proficiency Distribution** — visual breakdown of participants at each tier
* **Avg. Proficiency Over Time** — line chart showing the workspace-wide trend, with lift if there are 2+ data points
* **Participants Table** — individual participants with their observation count and proficiency tier/score
***
## Building Skill Reports
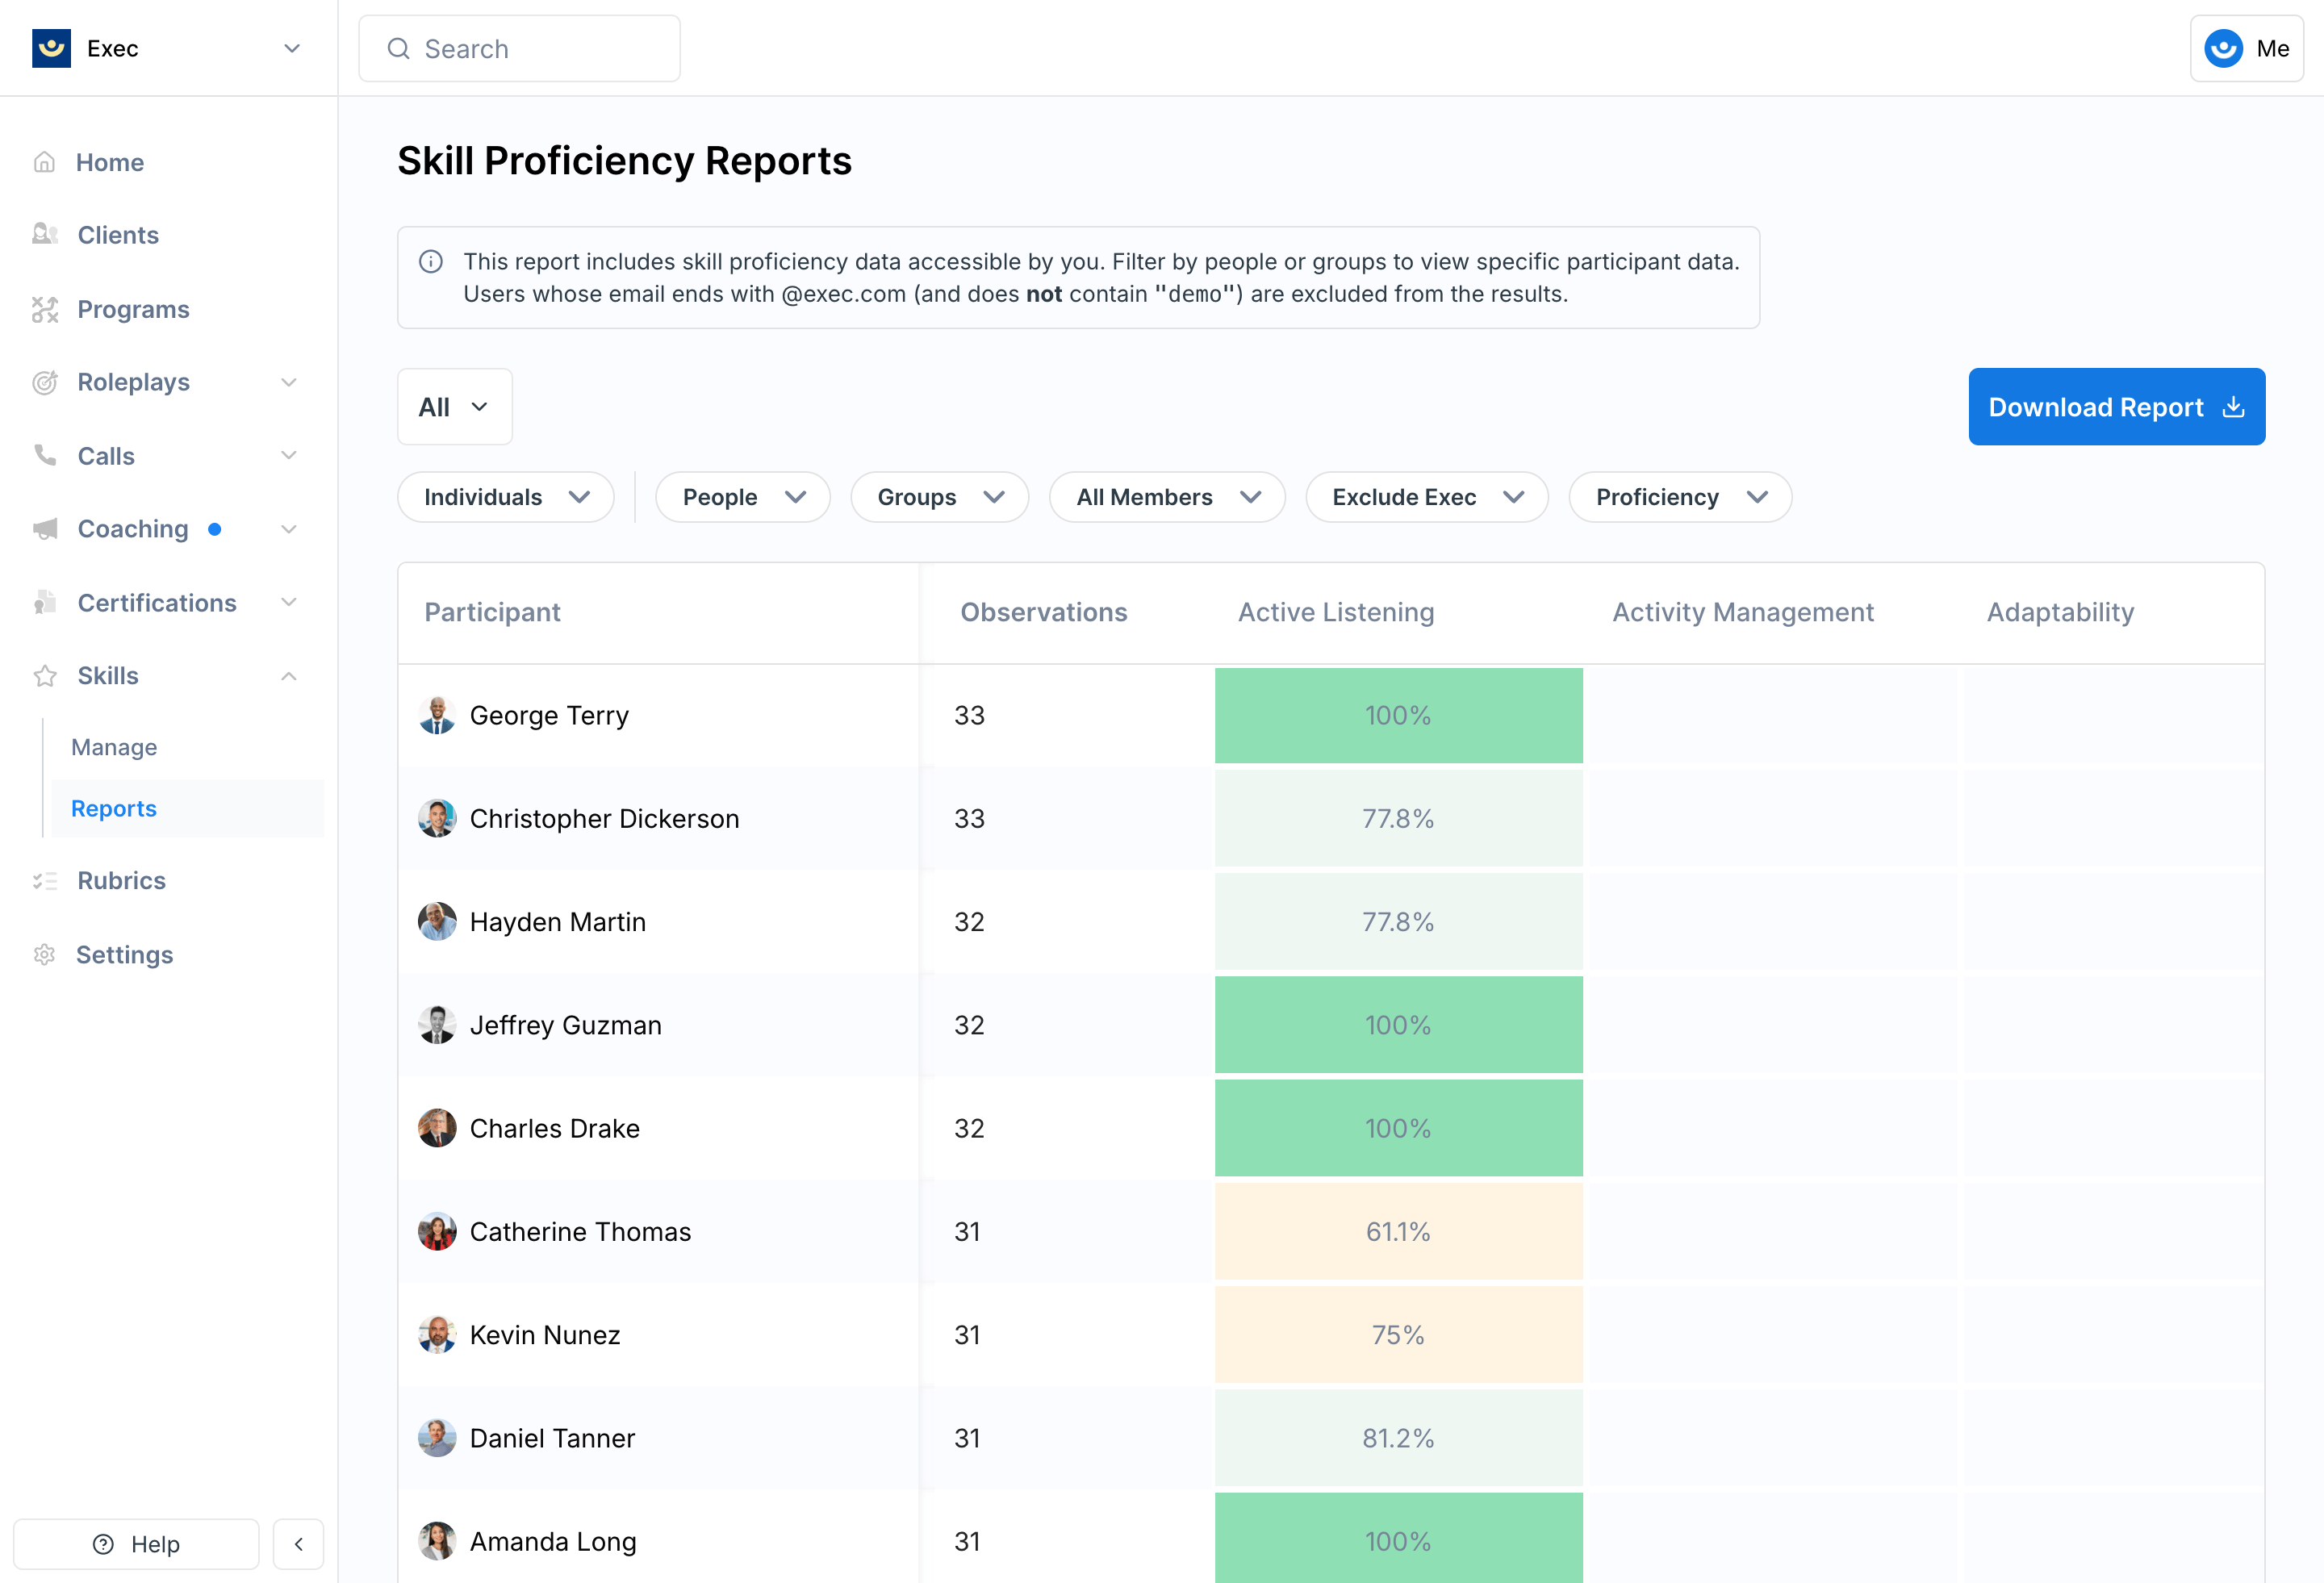 Navigate to **Skills → Reports** in the left sidebar.
Select **Individuals** to see each person's proficiency, or **Groups** to see team-level proficiency.
Narrow your view using the available filters:
| Filter | What It Does |
| :--------------------------- | :---------------------------------------------------------------------- |
| **Users** (individuals mode) | Limits to specific people |
| **Groups** | Limits to specific groups |
| **Proficiencies** | Shows only people or groups at selected tiers (e.g., only "Needs Work") |
| **Skip Unpracticed** | Hides people with no observations |
The report displays as a heatmap grid — rows are people (or groups), columns are skills, and cells are color-coded by proficiency tier.
Click any cell to see that person's (or group's) proficiency for that skill, including a trend chart, recent sessions, and the option to assign scenarios.
Download a CSV of the report or save your current view for quick access later.
### Individuals Mode
The individual proficiency heatmap shows rows (workspace members with avatar, name, and observation count), columns (skills), and cells color-coded by proficiency tier.
**Click a cell** to open the proficiency drilldown drawer:
* Weighted proficiency score and tier badge
* Proficiency over time chart
* 5 most recent sessions with scores and links to session details
* Assign Scenarios section for taking action directly
**Click a person's name** to see all of their skills in a list view.
### Groups Mode
Same heatmap structure, but rows are workspace groups rather than individuals. Shows aggregated group-level proficiency — the average across all group members. Click a cell to drill into individual member breakdowns.
Group reports are ideal for identifying which teams need additional support in specific skill areas. Compare groups side by side to spot training opportunities.
***
## Exporting Data
**CSV Export** — Click **Export** to download a file with participants (or groups) as rows, skills as columns, and proficiency scores as percentages.
**Saved Views** — Click **Save View** to save your current filter configuration for quick access. Useful when you regularly check the same group or skill combination.
***
## Getting Help
**Need help?** Contact us at [hello@exec.com](mailto:hello@exec.com) for guidance on building reports, interpreting proficiency data, or setting up regular reporting workflows.
Navigate to **Skills → Reports** in the left sidebar.
Select **Individuals** to see each person's proficiency, or **Groups** to see team-level proficiency.
Narrow your view using the available filters:
| Filter | What It Does |
| :--------------------------- | :---------------------------------------------------------------------- |
| **Users** (individuals mode) | Limits to specific people |
| **Groups** | Limits to specific groups |
| **Proficiencies** | Shows only people or groups at selected tiers (e.g., only "Needs Work") |
| **Skip Unpracticed** | Hides people with no observations |
The report displays as a heatmap grid — rows are people (or groups), columns are skills, and cells are color-coded by proficiency tier.
Click any cell to see that person's (or group's) proficiency for that skill, including a trend chart, recent sessions, and the option to assign scenarios.
Download a CSV of the report or save your current view for quick access later.
### Individuals Mode
The individual proficiency heatmap shows rows (workspace members with avatar, name, and observation count), columns (skills), and cells color-coded by proficiency tier.
**Click a cell** to open the proficiency drilldown drawer:
* Weighted proficiency score and tier badge
* Proficiency over time chart
* 5 most recent sessions with scores and links to session details
* Assign Scenarios section for taking action directly
**Click a person's name** to see all of their skills in a list view.
### Groups Mode
Same heatmap structure, but rows are workspace groups rather than individuals. Shows aggregated group-level proficiency — the average across all group members. Click a cell to drill into individual member breakdowns.
Group reports are ideal for identifying which teams need additional support in specific skill areas. Compare groups side by side to spot training opportunities.
***
## Exporting Data
**CSV Export** — Click **Export** to download a file with participants (or groups) as rows, skills as columns, and proficiency scores as percentages.
**Saved Views** — Click **Save View** to save your current filter configuration for quick access. Useful when you regularly check the same group or skill combination.
***
## Getting Help
**Need help?** Contact us at [hello@exec.com](mailto:hello@exec.com) for guidance on building reports, interpreting proficiency data, or setting up regular reporting workflows.