> ## Documentation Index
> Fetch the complete documentation index at: https://docs.exec.com/llms.txt
> Use this file to discover all available pages before exploring further.
# Track Program Progress
> Monitor completion rates, view analytics, and keep participants on track
Once your program is live, Exec gives you several views to monitor how participants are progressing through their components. This page covers the dashboard, details view, component analytics, and data exports.
***
## Program Dashboard
The dashboard is the first thing you see when you open a program. It gives you a high-level view of all components organized by their current status.
### Component Status Groups
Components are grouped into collapsible sections:
| Section | What it contains |
| ------------------- | ------------------------------------------------------------ |
| **In Design** | Components still being configured (visible to leads only) |
| **Ongoing** | Active components that participants are currently working on |
| **Looking Forward** | Upcoming components that have not launched yet |
| **Complete** | Components that have been finished or closed |
Each component card shows its type, name, dates, and a completion summary.
### Lead View vs Participant View
Program leads and participants see different things on the dashboard:
| Aspect | Leads see | Participants see |
| --------------------- | ----------------------------------------- | ------------------------------ |
| **Components** | All components in every status | Only their assigned components |
| **In Design section** | Visible | Hidden |
| **Quick Actions** | Add Component, Add Participants buttons | Not shown |
| **Analytics** | Completion counts across all participants | Their own status only |
If you are both a lead and a participant in the same program, you see both views with sections labeled "(As Participant)" for your participant-specific content.
### Right Panel
The right side of the dashboard shows:
* **Quick Actions** (leads only): Buttons to add components and participants
* **Certification Pipeline** (if a certification is linked): Progress visualization showing component completion status
* **Program Leads**: List of current leads with the ability to add or remove leads
* **Exec Contact**: Your Exec account manager, if assigned
***
## Program Details
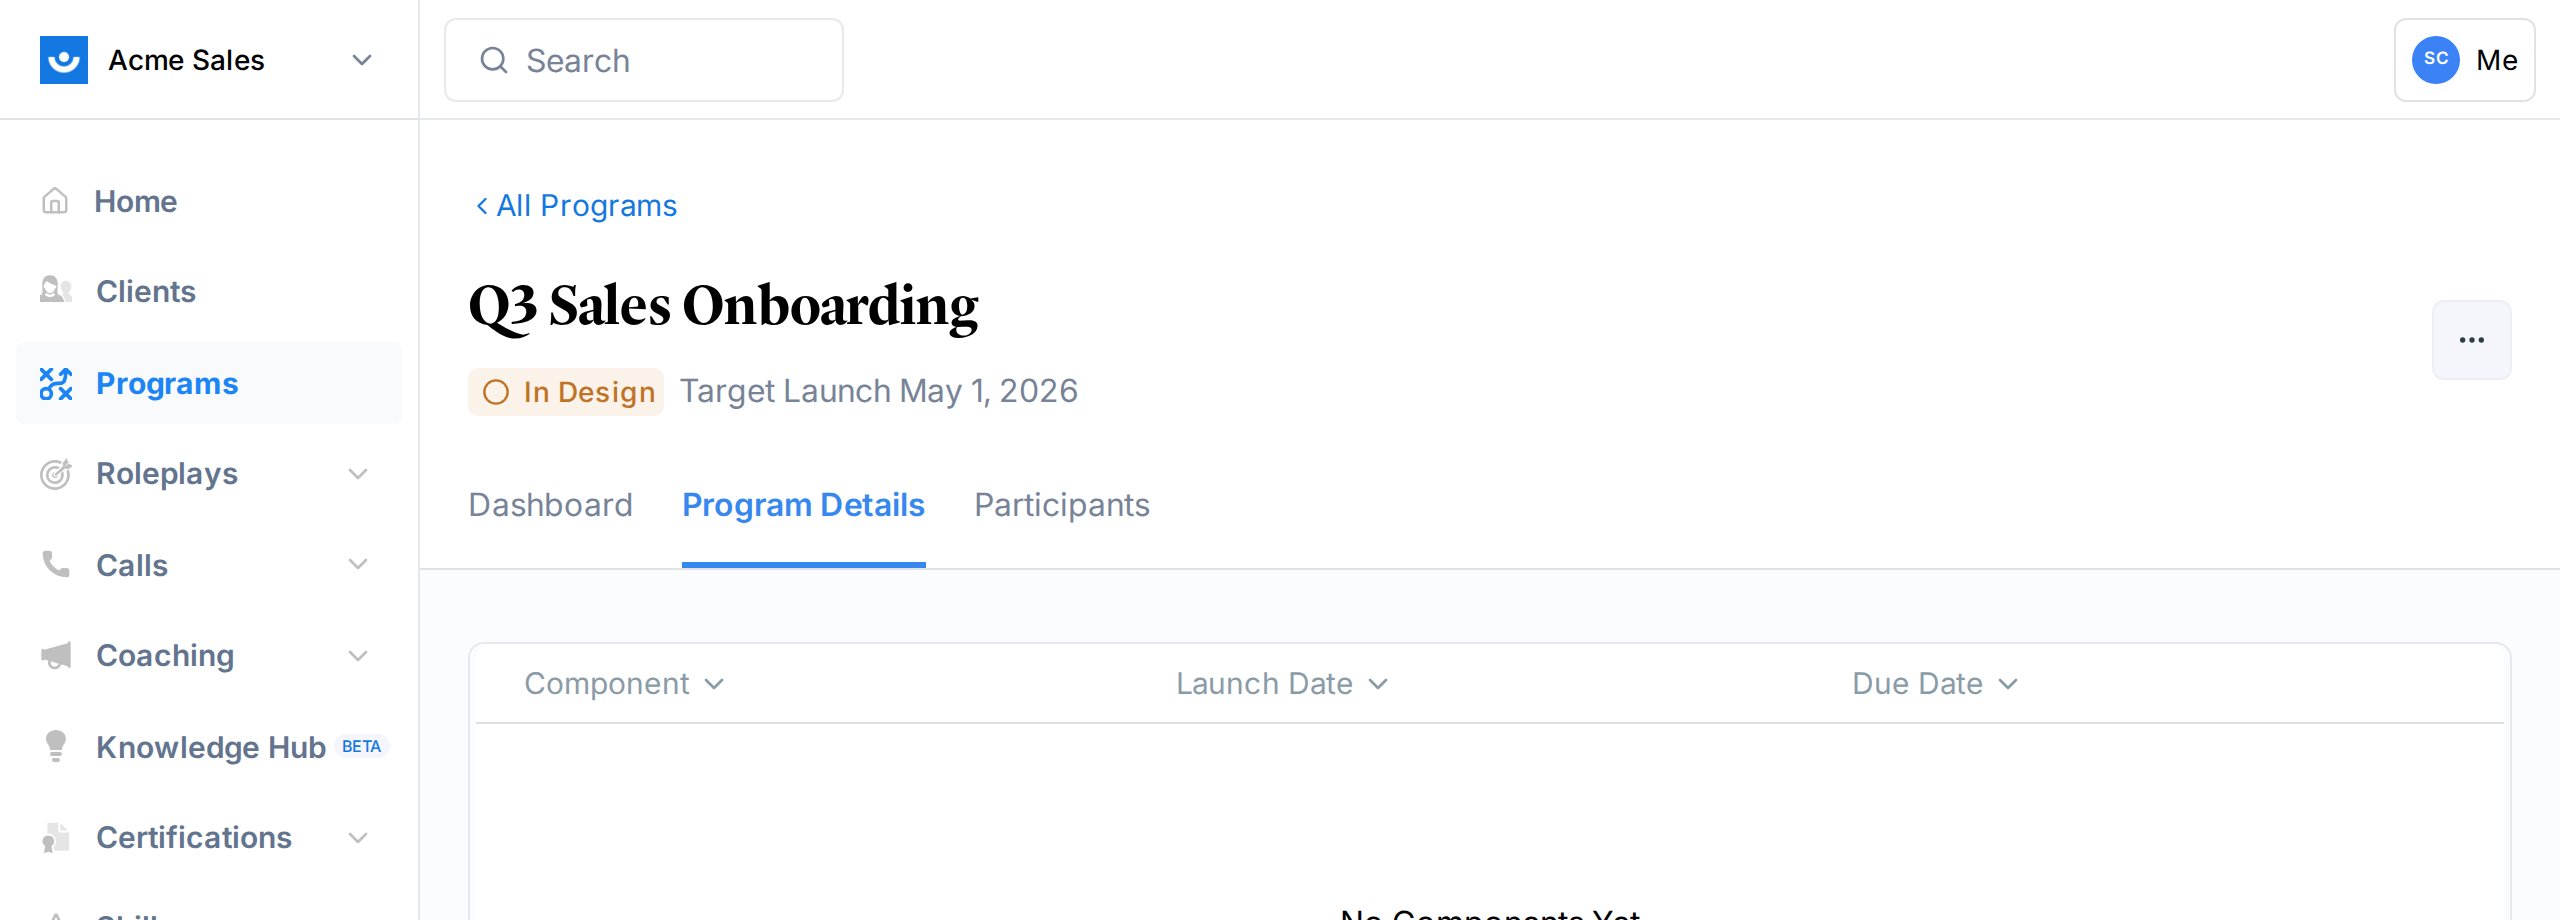
Click the **Program Details** tab for a more analytical view of your program.
 ### Default View: Timeline and Table
The default details view shows two things:
1. **Program Timeline**: A visual timeline showing when each component starts and ends. Switch between month and day views using the dropdown.
2. **Component Table**: A sortable table with columns for component name, launch date, due date, and close date (close date visible to leads only).
### Filtered Views by Component Type
Use the tabs to filter components by type:
* **Surveys** - All survey components
* **Action Items** - All action item components
* **AI Roleplays** - All roleplay components
* **Videos** - All video components
* **Articles** - All article components
* **Announcements** - All announcement components
* **Group Meetings** - All group meeting components
Each filtered view organizes components into In Design, Ongoing, Upcoming, and Complete sections with badges showing the count in each.
***
## Component Analytics
Click on any component from the details view to see its analytics. What you see depends on the component type.
### Surveys and Action Items
For survey and action item components, the analytics page shows:
* **Completion statistics**: How many participants have responded vs total
* **Per-question breakdown**: Each question shown as a collapsible card with:
* Response counts (completed, no response, not started)
* Top answers
* Expandable table of each participant's response
### AI Roleplays
For roleplay components, you see:
* **Performance by scenario**: Each scenario with a breakdown of participant ranks:
* Gold, Silver, Bronze, and Unranked counts
* Visual progress bar showing the rank distribution
* **Per-participant performance**: Expandable section showing each participant's rank and number of attempts per scenario
### 1:1 Coaching
Coaching components have the most detailed analytics:
* **General statistics**: Total participants, on-track percentage, average rating, completed sessions, total credits spent, active coaches
* **Session list**: Individual coaching sessions with dates, duration, coach, and participant
* **Coaches table**: Each coach with their assigned sessions, completed sessions, and completion rate
* **Session feedback**: Participant feedback and ratings from coaching sessions
* **Credit usage**: Breakdown of credits spent, scheduled, and forfeited across sessions
### Participant Response Table
All component types include a participant table showing:
| Column | What it shows |
| ------------------- | ----------------------------------------------------------------------- |
| **Name** | Participant name |
| **Status** | Completion status (Completed, In Progress, Not Started, Past Due, etc.) |
| **Due Date** | Deadline, shown in blue if extended |
| **Completion Date** | When they finished |
| **Last Reminded** | When they were last nudged |
| **Actions** | View responses, nudge, grant/revoke extension |
***
## Exporting Program Data
Program data is included in Exec's session data exports. When you export session data from **Settings > Export Data**, the CSV includes a `program` column showing which program each session belongs to.
[Learn about exporting data ->](/platform/export-data)
***
## Keeping Participants on Track
When participants fall behind, you have several tools:
| Tool | What it does | How to access |
| ----------------------- | ------------------------------------------------------------------------------- | ------------------------------------------------------- |
| **Nudge** | Send a reminder notification to participants who have not completed a component | Component participant table > Actions > Nudge |
| **Grant Extension** | Give participants more time by extending a component's due date | Component participant table > Actions > Grant Extension |
| **Notification Emails** | Automatic emails for launch, due, and past-due reminders | Configured per component in component settings |
[Learn more about nudges and extensions ->](/programs/manage-participants#sending-nudges)
***
## Getting Help
Need help tracking progress? Contact us at [hello@exec.com](mailto:hello@exec.com).
### Default View: Timeline and Table
The default details view shows two things:
1. **Program Timeline**: A visual timeline showing when each component starts and ends. Switch between month and day views using the dropdown.
2. **Component Table**: A sortable table with columns for component name, launch date, due date, and close date (close date visible to leads only).
### Filtered Views by Component Type
Use the tabs to filter components by type:
* **Surveys** - All survey components
* **Action Items** - All action item components
* **AI Roleplays** - All roleplay components
* **Videos** - All video components
* **Articles** - All article components
* **Announcements** - All announcement components
* **Group Meetings** - All group meeting components
Each filtered view organizes components into In Design, Ongoing, Upcoming, and Complete sections with badges showing the count in each.
***
## Component Analytics
Click on any component from the details view to see its analytics. What you see depends on the component type.
### Surveys and Action Items
For survey and action item components, the analytics page shows:
* **Completion statistics**: How many participants have responded vs total
* **Per-question breakdown**: Each question shown as a collapsible card with:
* Response counts (completed, no response, not started)
* Top answers
* Expandable table of each participant's response
### AI Roleplays
For roleplay components, you see:
* **Performance by scenario**: Each scenario with a breakdown of participant ranks:
* Gold, Silver, Bronze, and Unranked counts
* Visual progress bar showing the rank distribution
* **Per-participant performance**: Expandable section showing each participant's rank and number of attempts per scenario
### 1:1 Coaching
Coaching components have the most detailed analytics:
* **General statistics**: Total participants, on-track percentage, average rating, completed sessions, total credits spent, active coaches
* **Session list**: Individual coaching sessions with dates, duration, coach, and participant
* **Coaches table**: Each coach with their assigned sessions, completed sessions, and completion rate
* **Session feedback**: Participant feedback and ratings from coaching sessions
* **Credit usage**: Breakdown of credits spent, scheduled, and forfeited across sessions
### Participant Response Table
All component types include a participant table showing:
| Column | What it shows |
| ------------------- | ----------------------------------------------------------------------- |
| **Name** | Participant name |
| **Status** | Completion status (Completed, In Progress, Not Started, Past Due, etc.) |
| **Due Date** | Deadline, shown in blue if extended |
| **Completion Date** | When they finished |
| **Last Reminded** | When they were last nudged |
| **Actions** | View responses, nudge, grant/revoke extension |
***
## Exporting Program Data
Program data is included in Exec's session data exports. When you export session data from **Settings > Export Data**, the CSV includes a `program` column showing which program each session belongs to.
[Learn about exporting data ->](/platform/export-data)
***
## Keeping Participants on Track
When participants fall behind, you have several tools:
| Tool | What it does | How to access |
| ----------------------- | ------------------------------------------------------------------------------- | ------------------------------------------------------- |
| **Nudge** | Send a reminder notification to participants who have not completed a component | Component participant table > Actions > Nudge |
| **Grant Extension** | Give participants more time by extending a component's due date | Component participant table > Actions > Grant Extension |
| **Notification Emails** | Automatic emails for launch, due, and past-due reminders | Configured per component in component settings |
[Learn more about nudges and extensions ->](/programs/manage-participants#sending-nudges)
***
## Getting Help
Need help tracking progress? Contact us at [hello@exec.com](mailto:hello@exec.com).